

Trading is an art form, and like any great artist, a trader needs the right tools to create a masterpiece. Enter Heikin Ashi candles, the unsung heroes of the trading world. Their ability to smooth out market noise and present a clearer picture of trends makes them an invaluable asset for traders. Whether you’re a seasoned pro or a novice dipping your toes into the volatile waters of forex, learning to trade with Heikin Ashi candles could be your ticket to a more profitable trading journey. This guide will unravel the mysteries of Heikin Ashi candles, offering strategies and tips to help you harness their full potential. So, grab your trading palette and let’s paint a brighter financial future together.
How Heikin Ashi Candles Filter Market Noise for Clearer Trends
Heikin Ashi candles are designed to filter out market noise and provide a clearer representation of price trends. Unlike traditional candlestick charts that can often be erratic and difficult to interpret, Heikin Ashi candles smooth out price data by averaging it over two periods. This results in a more visually coherent chart that makes it easier for traders to identify trends and potential reversal points. For instance, a series of green Heikin Ashi candles with no lower shadows typically indicates a strong uptrend, while red candles with no upper shadows suggest a strong downtrend.
One of the key benefits of using Heikin Ashi candles is their ability to reduce the emotional stress associated with trading. By providing a clearer picture of the market’s direction, these candles help traders make more informed decisions and avoid the pitfalls of reacting to short-term price fluctuations. This can be particularly useful in volatile markets where noise can obscure the underlying trend. Additionally, Heikin Ashi candles can be used in conjunction with other technical indicators, such as moving averages or the Relative Strength Index (RSI), to further enhance their effectiveness and provide a more comprehensive trading strategy.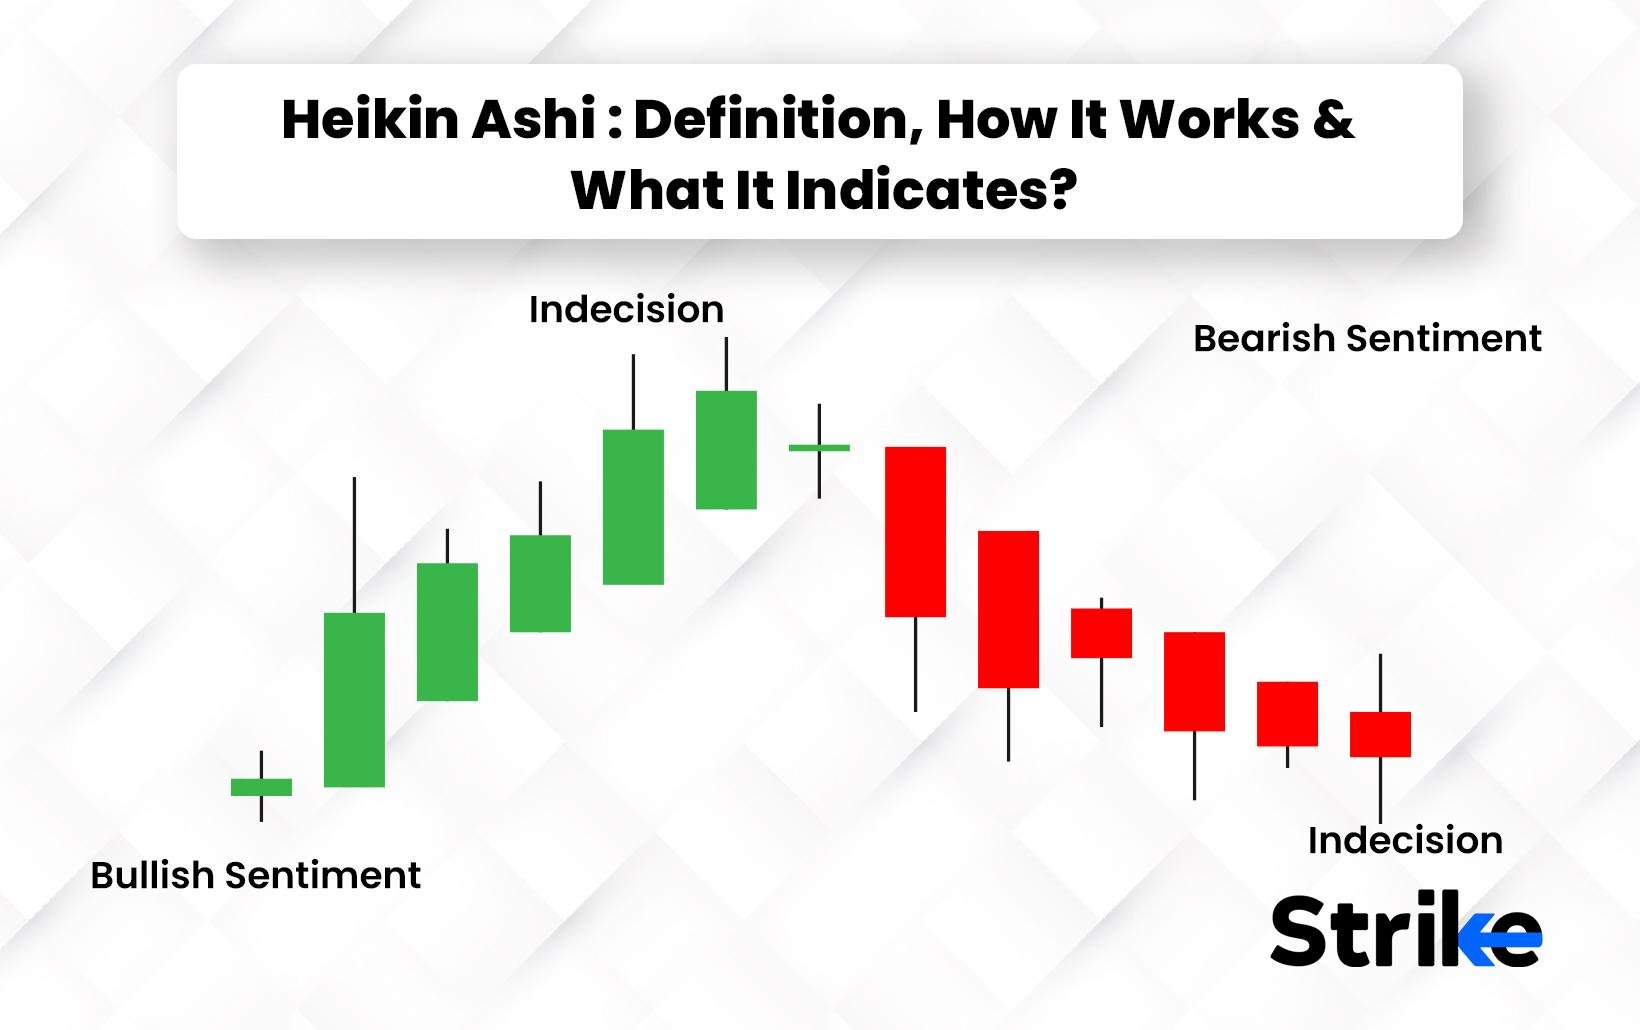
Implementing Heikin Ashi in Your Trading Strategy: Key Techniques
One of the key techniques to master when implementing Heikin Ashi in your trading strategy is understanding its unique candle construction. Unlike traditional candlestick charts, Heikin Ashi modifies the open, high, low, and close (OHLC) values to create a smoother appearance. This helps traders filter out market noise and identify trends more clearly. The formula for Heikin Ashi candles is quite straightforward: the open price is the average of the previous Heikin Ashi candle’s open and close, while the close price is the average of the current period’s open, high, low, and close prices. The high and low are the maximum and minimum values of the current period’s high, low, and Heikin Ashi open and close. By averaging these values, Heikin Ashi charts reduce the impact of short-term fluctuations, giving a clearer picture of the overall trend.
Another effective technique is to combine Heikin Ashi with other indicators to enhance its predictive power. For example, integrating the Heikin Ashi indicator with a moving average can help confirm trend directions and identify potential reversal points. The Heikin Ashi Smoothed version, which uses moving averages to further smooth out the price data, can be particularly useful for longer-term trend analysis. Additionally, incorporating volume indicators can provide insights into the strength of a trend, helping traders decide whether to enter or exit a position. By using Heikin Ashi candles in conjunction with other technical analysis tools, traders can develop a more robust and reliable trading strategy.
Heikin Ashi vs Traditional Candlesticks: Which is Better for You?
When comparing Heikin Ashi candles to traditional candlesticks, it’s clear that each method has its own strengths. Heikin Ashi candles excel in filtering out market noise, which makes them a favorite for trend-following strategies. By averaging price data, these candles provide a smoother visual representation of price movements, making it easier to identify trends and reversals. For instance, the Heikin Ashi OHLC Indicator transforms erratic price movements into a more comprehensible representation of market trends, helping traders spot bullish and bearish periods with greater accuracy. This can be particularly beneficial in volatile markets where traditional candlesticks might produce misleading signals due to their sensitivity to every price movement.
On the other hand, traditional candlesticks offer a more detailed and immediate picture of market activity, which can be crucial for day traders and those who rely on real-time data. They capture every price movement, making them ideal for identifying specific patterns like Doji, Hammer, and Engulfing patterns, which are essential for making quick trading decisions. However, this level of detail can also lead to information overload, especially in markets with high volatility. For traders who prefer a clearer and less stressful trading environment, Heikin Ashi candles might be the better choice, as they reduce the emotional strain by providing a more stable view of market trends【4:0†source】【4:1†source】.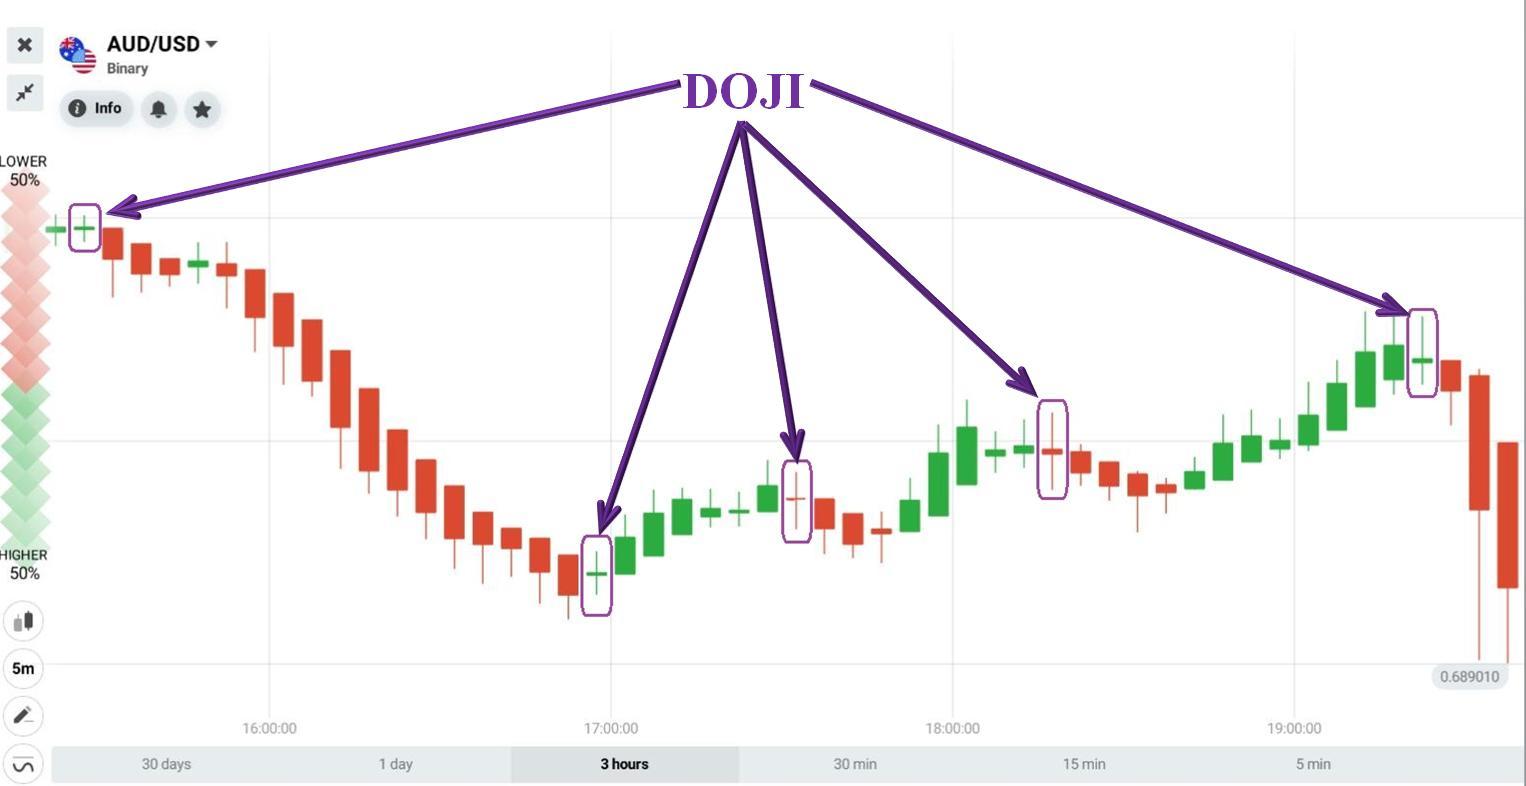
Maximizing Profits with Heikin Ashi: Tips from Expert Traders
When trading with Heikin Ashi candles, the key is to focus on the smooth representation of market trends. By utilizing the Heikin Ashi OHLC Indicator, traders can easily identify bullish and bearish periods, making their trading decisions sharper and more precise. For instance, during a strong uptrend, the Heikin Ashi candles will typically show no lower shadows, indicating a robust upward movement. Conversely, a strong downtrend will display candles with no upper shadows. This visual clarity allows traders to enter and exit trades at optimal times, minimizing risks and maximizing profit potential.
Incorporating Heikin Ashi into your strategy can significantly reduce the emotional stress associated with trading. The indicator simplifies complex market data, cutting through the noise and providing a clear picture of the prevailing trend. Whether you’re trading Forex, stocks, or cryptocurrencies, the Heikin Ashi method offers a versatile tool that adapts to various market conditions. For example, traders using the Heikin Ashi Dashboard can monitor multiple currency pairs and timeframes, ensuring they never miss a critical trend reversal or consolidation period. This comprehensive approach empowers traders to make informed decisions, enhancing their overall trading performance.
Comparing Trading Robots: Heikin Ashi OHLC Indicator vs Forex Gump
When comparing the Heikin Ashi OHLC Indicator and the Forex Gump, the distinctions become vividly clear. The Heikin Ashi OHLC Indicator excels in providing a smoother, more comprehensible representation of market trends. It modifies traditional candlestick charts to filter out noise, making it easier for traders to identify trends and potential reversal points. This indicator is particularly user-friendly, allowing traders to display Heikin Ashi and Heikin Ashi Smoothed candles simultaneously or separately, and supports multiple averaging methods including Simple, Exponential, Smoothed, and Linear Weighted Moving Averages. Its versatility extends across all timeframes and market types, from Forex to stocks and cryptocurrencies, making it a go-to tool for those seeking clarity in chaotic market conditions.
On the other hand, Forex Gump takes a more straightforward approach with its signal-based trading system. It offers clear buy and sell signals through blue and red arrows, respectively, and advises closing trades when a yellow cross appears. This system is designed to operate on larger timeframes (H1, H4, D1) to minimize broker spread and swap influences, making it less susceptible to market noise. Forex Gump’s no-nonsense design ensures there’s no signal repainting or delays, and it works across all currency pairs and timeframes. However, its reliance on specific signals might be limiting for traders looking for a more nuanced analysis of market trends.
Case Study: Heikin Ashi in Action with AlphaTradeBot and Marley Indicator
The Marley Indicator is a versatile tool optimized for both crypto and forex markets, delivering precision through Heikin Ashi based signals. It integrates seamlessly with both MT4 and MT5 platforms, allowing traders to choose between visually striking arrows or informative text labels for signal display. With adjustable sensitivity and advanced ATR period customization, the indicator swiftly adapts to fluctuating market conditions, enhancing your analysis. Customizable visuals and real-time alerts ensure you never miss a trading opportunity, making Marley Indicator an essential companion in your trading journey.
Meanwhile, the AlphaTradeBot Breakout EA II specializes in mastering breakout strategies, particularly on the XAUUSD 5-minute chart. It employs sophisticated algorithms to identify key breakout points, enabling strategic market entry and exit. Dynamic money management options and advanced stop loss and take profit tactics safeguard investments while maximizing profits. This EA’s ability to analyze historical data and monitor real-time market movements ensures precise execution of trades at confirmed breakout points, making it a powerful tool for traders aiming to capitalize on market breakouts.
Q&A
Q: What are Heikin Ashi candles and how do they differ from traditional candlesticks?
A: Heikin Ashi candles are a type of candlestick chart that aims to filter out market noise by averaging price data. Unlike traditional candlesticks that use open, high, low, and close prices, Heikin Ashi candles use a modified formula based on two-period averages. This results in a smoother appearance, making trends and reversals easier to spot, but it also obscures gaps and some price data.
Q: How can I use Heikin Ashi candles to identify trends?
A: Heikin Ashi candles are particularly useful for identifying trends due to their smoothing effect. Bullish trends are typically represented by consecutive green candles with little to no lower shadows, while bearish trends are indicated by consecutive red candles with little to no upper shadows. This visual clarity helps traders make more informed decisions by focusing on the overall trend rather than individual price movements.
Q: What are some common strategies for trading with Heikin Ashi candles?
A: One common strategy is to use Heikin Ashi candles in conjunction with traditional indicators such as Moving Averages or MACD. For example, traders might look for a series of green Heikin Ashi candles to confirm a bullish trend and then use a Moving Average crossover to time their entry. Conversely, a series of red candles might indicate a bearish trend, prompting traders to look for shorting opportunities.
Q: Can Heikin Ashi candles be used on all timeframes?
A: Yes, Heikin Ashi candles can be used on any timeframe, from one-minute charts to monthly charts. However, they are often more effective on higher timeframes like H1, H4, and D1, where the reduced noise makes it easier to identify and follow trends.
Q: Are there any limitations to using Heikin Ashi candles?
A: While Heikin Ashi candles are great for identifying trends, they do have limitations. The smoothing effect can sometimes delay signals, causing traders to enter or exit trades later than they would using traditional candlesticks. Additionally, because they average price data, Heikin Ashi candles can obscure important price information such as gaps and specific high or low points.
Q: How can I incorporate Heikin Ashi candles into my existing trading strategy?
A: To incorporate Heikin Ashi candles into your existing strategy, consider using them as a trend confirmation tool. For instance, if your strategy involves entering trades based on support and resistance levels, you can use Heikin Ashi candles to confirm the trend direction before making a move. Additionally, combining Heikin Ashi candles with indicators like the MACD or RSI can help filter out false signals and improve the overall accuracy of your trades.
Q: Are there any recommended indicators to use with Heikin Ashi candles for better results?
A: Yes, combining Heikin Ashi candles with indicators such as Moving Averages, the MACD, and the RSI can enhance your trading strategy. Moving Averages can help identify the overall trend direction, while the MACD can provide momentum signals. The RSI can be used to spot overbought or oversold conditions, adding another layer of confirmation to your trades.
To Wrap It Up
As we wrap up our exploration of Heikin Ashi candles and the myriad strategies they unlock, remember that the market, much like life, is an unpredictable journey. Whether you’re a seasoned trader or a novice just dipping your toes in the forex waters, Heikin Ashi offers a unique lens to interpret market movements, smoothing out the noise and providing clarity in chaos. Take these strategies, test them, and mold them to fit your trading style. And as always, trade smart, stay informed, and may your candlesticks always be green.