

In the bustling world of financial trading, navigating the myriad of indicators and strategies can seem daunting. Today’s spotlight falls on the VWAP, or Volume Weighted Average Price indicator, a powerful tool that has become a staple among traders. Whether you are a novice dipping your toes into the waters of stock trading or an experienced trader looking to refine your technique, mastering VWAP can offer crucial insights into market behavior. This step-by-step guide will walk you through the process of setting up the VWAP indicator, unraveling its complexities, and arming you with the knowledge to leverage this tool effectively. Join us on this educational journey to enhance your trading acumen.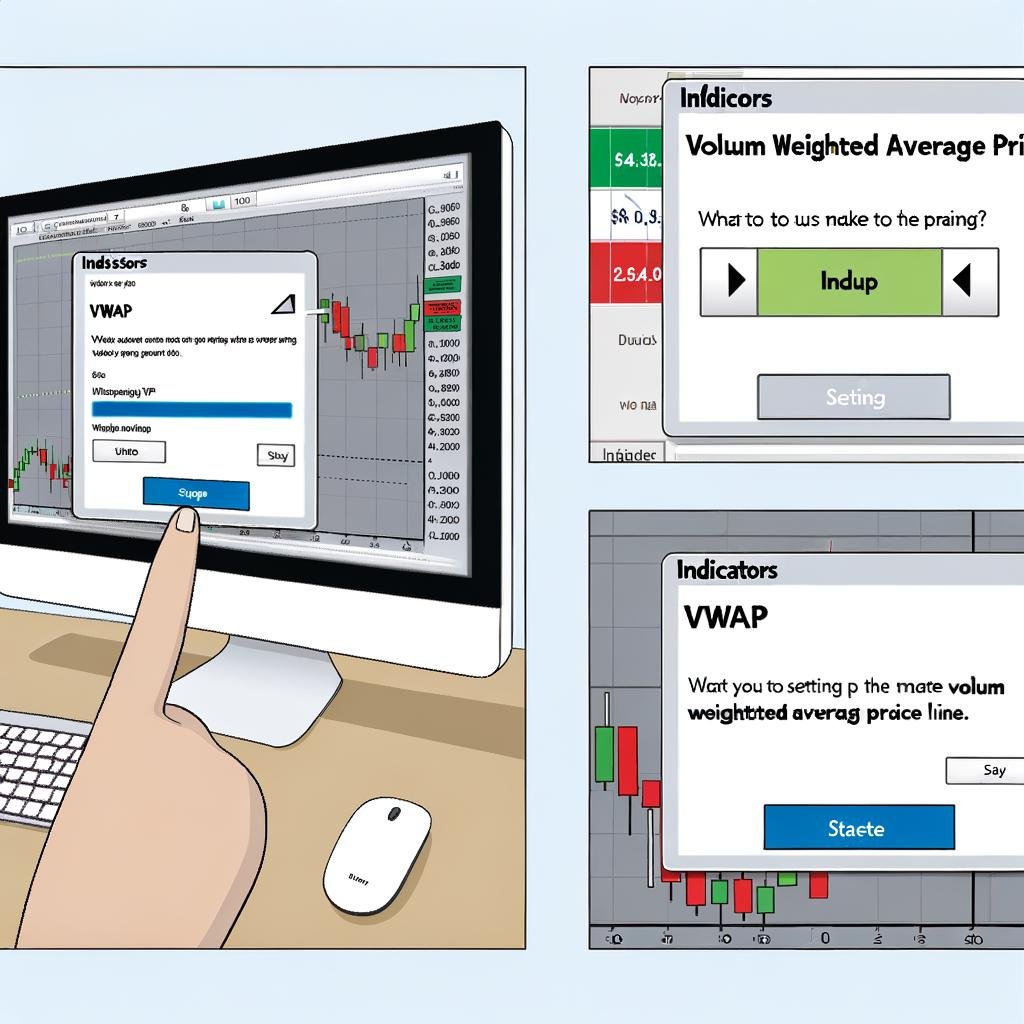
Understanding VWAP: The Basics and Benefits
Volume Weighted Average Price (VWAP) serves as a key indicator in the trading world, combining price and volume data to provide critical market insights. By reflecting the average price a security has traded at throughout the day, weighted by volume, VWAP helps investors understand the true market value. This can be especially beneficial in maintaining objectivity, as it remains unaffected by sudden price spikes or falls, providing a more genuine reflection of market sentiment.
Not only does VWAP aid in better price execution, but it also plays an essential role in market analysis. Traders frequently use this indicator to identify **wider trends** and assess market timing. Key benefits of integrating VWAP into your trading strategy include:
- **Improved Trade Execution**: Ensures trades are made at advantageous price points.
- **Objective Market Analysis**: Eliminates the impact of anomalies like sudden spikes.
- **Trend Identification**: Helps in determining buy and sell signals based on market momentum.
| Data Point | Description |
| Daily VWAP | Average trading price, weighted by volume. |
| Price vs. VWAP | Helps identify overbought/oversold conditions. |
Essential Tools and Platforms for VWAP Analysis
Getting started with VWAP analysis requires a solid set of tools and platforms to ensure accuracy and efficiency. Here’s a breakdown of the **essential tools** you’ll need:
- Charting Software: Look for platforms like TradingView, MetaTrader, or ThinkOrSwim. These platforms offer comprehensive charting capabilities and can overlay the VWAP indicator onto your trading charts seamlessly.
- Data Feeds: Reliable data is crucial. Opt for real-time data providers like Bloomberg, Reuters, or CQG to ensure your VWAP readings are current and accurate.
- Broker Integration: Ensure your broker platform supports VWAP. Brokers like Interactive Brokers, NinjaTrader, or E*TRADE offer robust VWAP tools integrated into their trading interfaces.
Let’s dive into the **key platforms** that can elevate your VWAP analysis:
| Platform | Key Feature | Price Range |
|---|---|---|
| TradingView | User-friendly interface | Free to Pro $ |
| MetaTrader | Advanced analytical tools | Free $ |
| ThinkOrSwim | Customizable indicators | Free with TD Ameritrade account $ |
Configuring VWAP on Popular Trading Software
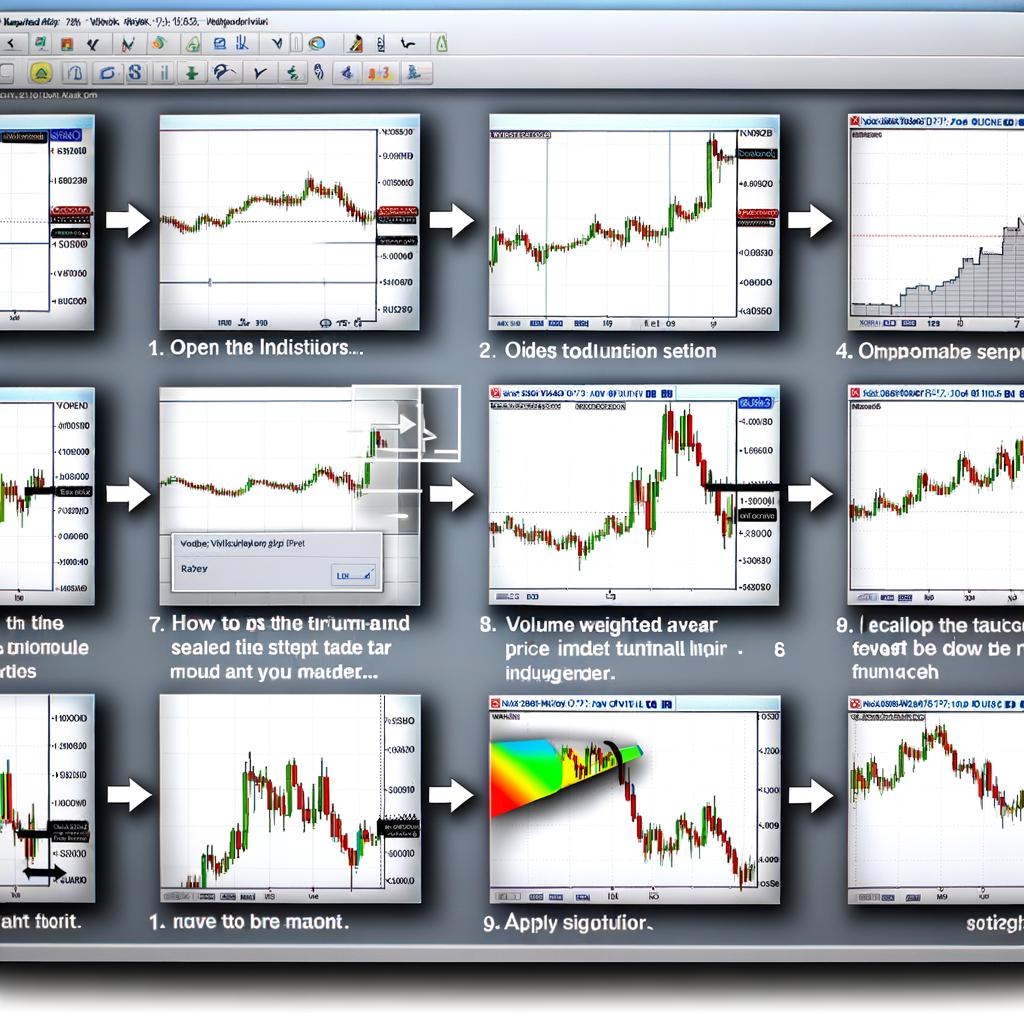
First, open your trading software and locate the Indicators section. This is usually found under the main menu or in a side panel. In platforms like MetaTrader 4 (MT4), you’ll find it under the Navigator window. In ThinkorSwim, simply use the Edit Studies button. From the list of available indicators, select the VWAP (Volume Weighted Average Price). Upon selection, a settings menu should appear, allowing you to configure the VWAP’s parameters. Typically, default settings work well, but you might want to adjust the calculation period or color scheme to fit your personal preference.
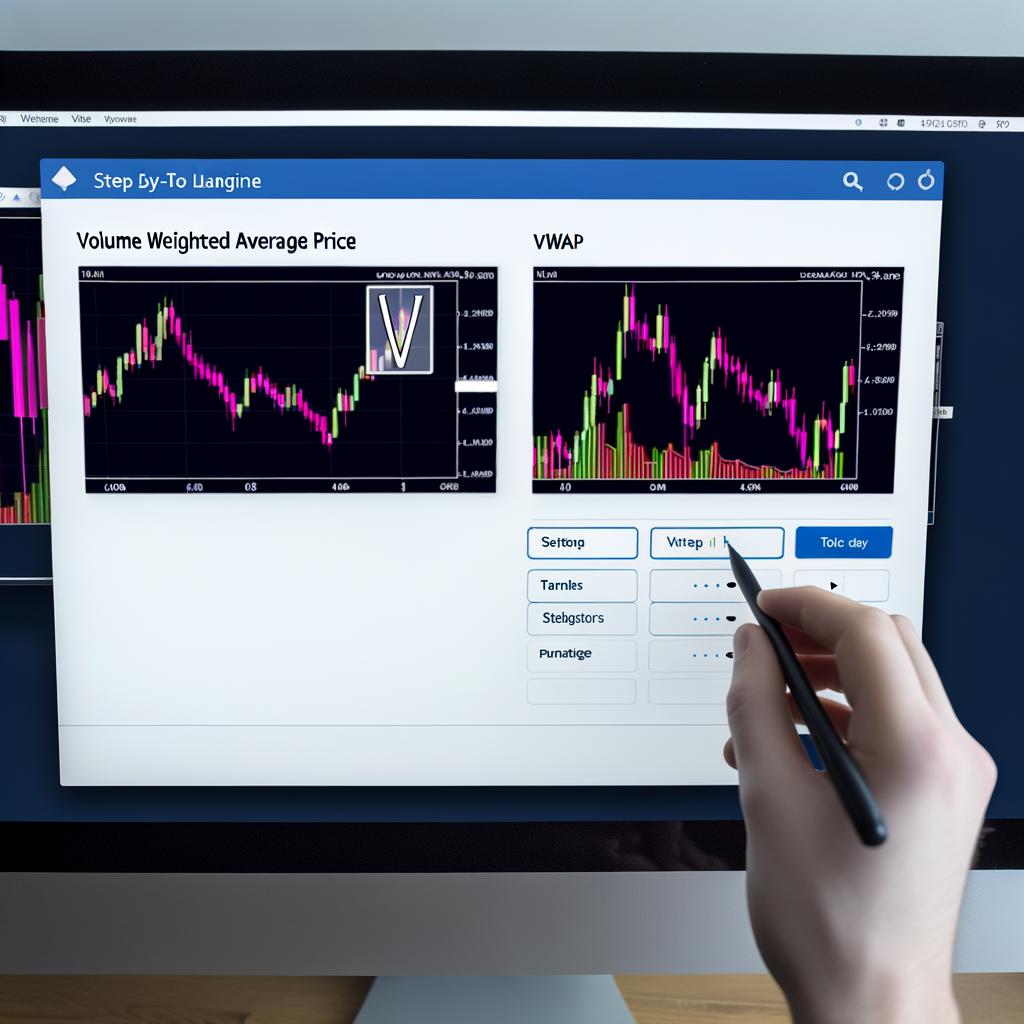
For enhanced visualization, customize the VWAP line by choosing a distinct color and line style. For instance:
- Color: Choose a color that stands out against your chart background. Common choices are blue, orange, or purple.
- Line Style: Opt for a solid, dashed, or dotted line to differentiate VWAP from other indicators.
Below is a simple comparison table showcasing default VWAP settings across various popular trading platforms:
| Trading Software | Default VWAP Color | Default Line Style |
|---|---|---|
| MetaTrader 4 | Blue | Solid |
| ThinkorSwim | Orange | Dashed |
| TradingView | Purple | Dotted |
Once your settings are saved, the VWAP line will appear on your chart, enabling you to make more informed trading decisions based on volume-weighted average prices.
Customizing VWAP for Different Trading Strategies
VWAP, or Volume Weighted Average Price, is a versatile tool that can be tailored to fit a variety of trading strategies. For **day traders**, the focus might be on intraday VWAP, providing real-time insight to make swift decisions on buying or selling. Conversely, **swing traders** might configure VWAP to reflect longer time periods, aligning it with their trading horizon and smoothing out short-term fluctuations.
Customizing VWAP settings involves more than just adjusting time frames. One can incorporate **bands** to identify overbought or oversold conditions, or add **volume-based filters** to highlight significant price movements supported by strong trading activity. Here are a few approaches:
- Bands: Create upper and lower bands around VWAP, often set at ±1 or ±2 standard deviations, to understand price deviations more clearly.
- Volume Filters: Focus on trades exceeding a certain volume threshold to capture meaningful shifts in market dynamics.
- Multi-Timeframe Analysis: Use VWAP from larger timeframes like weekly or monthly charts to guide trades on smaller timeframes.
| Swing Traders | Day Traders |
|---|---|
| Align with longer horizons | Intraday insights |
| Smooth out short-term fluctuations | Real-time decision making |
Interpreting VWAP Signals in Various Market Conditions
Understanding how to interpret VWAP signals in different market conditions can significantly enhance your trading strategy. During **bullish trends**, when the price remains consistently above the VWAP line, it indicates strong buying pressure and can offer confirmation for long positions. Conversely, in a **bearish market**, if the price stays below the VWAP, it signifies selling pressure, suggesting that short positions might be more advantageous. Sometimes, the price can oscillate around the VWAP in a sideways market, signaling uncertainty and a wait-and-see approach could be prudent.
Additionally, variations in the VWAP’s slope can provide further insights. A **rising VWAP** line suggests an overall increase in trading volume at higher prices, often reinforcing bullish sentiment. On the other hand, a **falling VWAP** implies decreasing prices and volume, indicating bearish conditions. Traders also monitor price action against the VWAP for potential **reversal points**. For example, a sharply falling price that touches and then reverses at the VWAP can be an early sign of a trend change. Here’s a quick overview:
| Market Condition | Price Relative to VWAP | Trading Signal |
|---|---|---|
| Bullish | Above VWAP | Go Long |
| Bearish | Below VWAP | Go Short |
| Sideways | Around VWAP | Neutral/Wait |
Incorporating these VWAP signals into your market analysis can provide you with a more nuanced understanding of price dynamics and help improve your trading decisions.
Best Practices for Integrating VWAP into Your Trading Routine
To effectively utilize the Volume Weighted Average Price (VWAP) in your trading strategy, start by understanding its core advantages. **VWAP** serves multiple purposes, including identifying the market trend, determining entry and exit points, and validating trade ideas. Integrate the indicator during your pre-trade analysis to enhance decision-making and boost profitability. Consider these key practices:
- **Overlay VWAP on your primary trading charts**: This helps you visualize the average trading price and volume throughout the day.
- **Use VWAP in combination with other indicators**: It complements tools like Moving Averages and RSI, providing a more holistic view.
- **Adjust VWAP settings based on your trading style**: Day traders may prefer shorter intervals, while swing traders might opt for extended time frames.
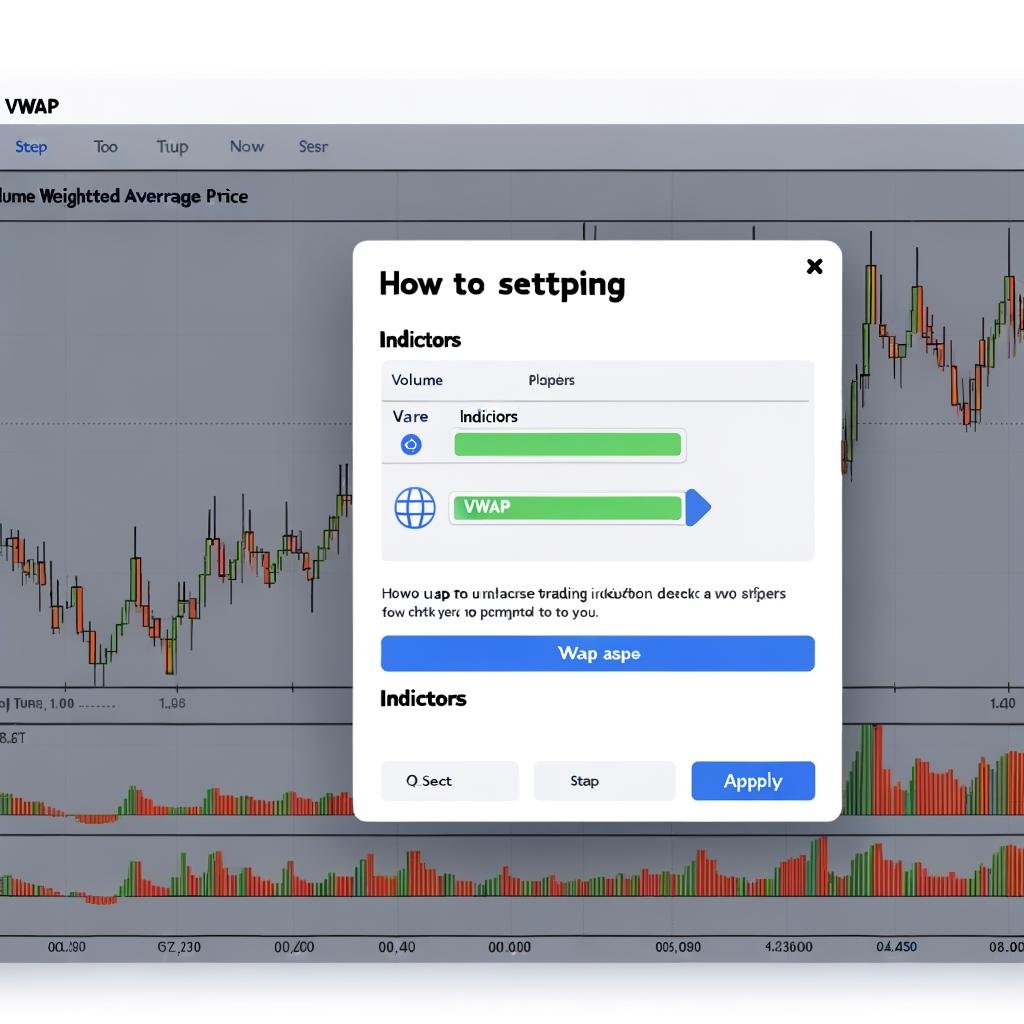
Implementing VWAP effectively also involves routine calibration. Customize your charts by altering colors and styles to distinguish VWAP lines from other indicators. Experiment with VWAP sessions to align with market open and close times pertinent to your trading hours. Here’s a quick reference for setting up VWAP:
| Action | Setting |
|---|---|
| Select VWAP timeframe | Intraday / Daily / Weekly |
| Choose VWAP line color | Customizable in Chart Settings |
| Combine with other indicators | Moving Averages, RSI, MACD |
Q&A
Q: What is the VWAP indicator, and why is it important in trading?
A: The VWAP, or Volume-Weighted Average Price, is a trading benchmark that provides insight into the average price a security has traded at throughout the day, factoring in both price and volume. It is crucial because it helps traders understand the market trend and make informed decisions.
Q: What are the initial steps to take before setting up the VWAP indicator?
A: First, ensure you have access to a reliable trading platform that supports technical indicators. Next, familiarize yourself with the platform’s analytical tools. gather historical price and volume data for the security you wish to analyze.
Q: How do you locate the VWAP indicator on most trading platforms?
A: On most trading platforms, navigate to the indicators or technical analysis section. Look for the VWAP option, which is usually listed under volume-based or price-based indicators.
Q: What should you consider when configuring the VWAP settings?
A: When configuring the VWAP settings, consider the duration for which you want the VWAP to be calculated, as default settings typically apply the indicator over one trading day. Adjust other preferences like color and thickness for better visibility on your chart.
Q: How does one interpret signals from the VWAP indicator in trading?
A: If the current price is above the VWAP, it indicates bullish sentiment, suggesting a potential buy opportunity. Conversely, if the price is below the VWAP, it signals bearish sentiment, possibly indicating a selling opportunity.
Q: Can the VWAP indicator be used alongside other indicators?
A: Yes, the VWAP can be effectively used in conjunction with other technical indicators like Moving Averages or Bollinger Bands to confirm trends and improve the accuracy of trading signals.
Q: What is the best practice in using the VWAP indicator for day trading?
A: For day trading, use the VWAP to gauge the true average price during the day and make trades when there are significant deviations from this average, ensuring you consider both price movements and volume changes comprehensively.
In Retrospect
As you embark on your trading journey with the VWAP indicator, remember that every tool in your arsenal is a step towards mastering the intricacies of the market. The versatility and precision that VWAP offers can be a guiding light through the often tumultuous waves of trading. By understanding its setup and integration, you are now equipped to leverage this powerful indicator to enhance your trading strategy. Continue to explore, learn, and adapt, for it is through persistent effort and dedication that one truly thrives in the world of trading. Let the VWAP be not just an instrument, but a trusted ally in your quest for financial growth.